This page describes an investigation of the dynamic response of pacinian corpuscles. Results are broadly in line with the model proposed by Loewenstein and Skalak in 1966. Experiments were carried out by Lana Pitts-Yushchenko and Ian Summers, as part of a project funded by the Leverhulme Trust (co-workers Joanne Dale and Peter Winlove). These results were presented at the 2013 Euromov Conference in Montpelier, France. Related earlier work in Exeter [1] has involved psychophysics experiments and MR imaging of pacinian corpuscles.
INTRODUCTION
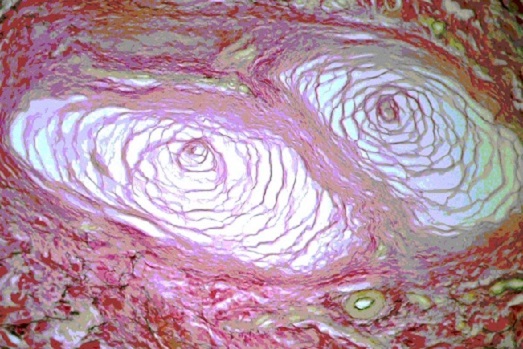
Pacinian corpuscles are widely distributed in the body, providing information for the tactile and kinaesthetic senses. The layered structure of the corpuscles (Fig.1) is presumed to be a determinant of the characteristic frequency response: peak response to displacement is typically at around 250 Hz. The present study provides data to inform theoretical models of the corpuscle, e.g., [2].
METHOD
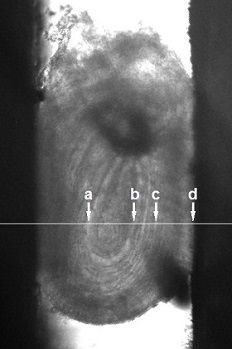
Measurements have been performed on excised equine corpuscles. The corpuscle (surrounded by saline solution) is positioned between two metal plates, one stationary and the other oscillating sinusoidally with a displacement amplitude of around 20 microns peak-to-peak (Fig. 2). Conventional light microscopy is used to image a central plane of the corpuscle; images are obtained at different phase steps within the sine wave of mechanical stimulation.
Figure 2: A pacinian corpuscle positioned between (left) a stationary metal plate, and (right) a metal plate which vibrates so as to apply a periodic sinusoidal compression to the corpuscle. Line profiles are taken across the corpuscle (horizontal line). Field of view is 600 × 900 microns. The features a and b mark the boundary between inner and outer regions of the corpuscle; c is a lamellar feature in the outer region and d is the surface of the corpuscle.
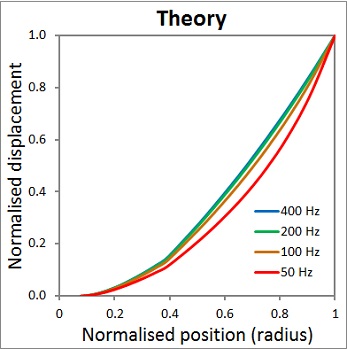
Figure 5: Theoretical model. Displacement amplitude (relative to amplitude at the outer surface) as a function of position.
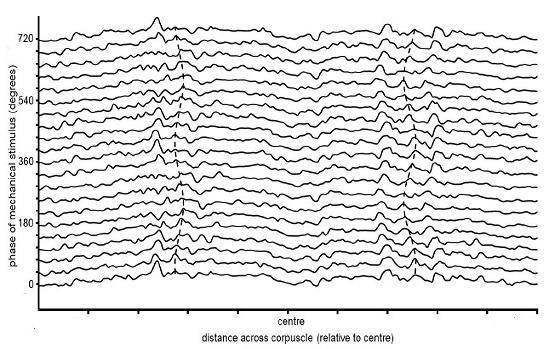
Figure 3: Line profiles across the corpuscle, for 21 phase steps over two cycles of stimulation at 100 Hz. (Note position is measured relative to the corpuscle centre, so left and right move in antiphase.)
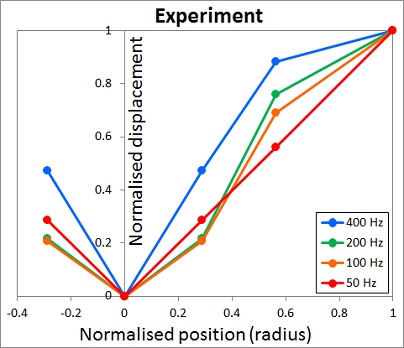
Figure 4: Experimental results. Displacement amplitude (relative to amplitude at the outer surface) as a function of position.
Figure 1: Micrograph of pacinian corpuscles in the equine hoof (field of view 500×300 microns)
REFERENCES
[1] NL Cornes, R Sulley, AC Brady and IR Summers, Measurements on pacinian corpuscles in the fingertip, Proc. ENACTIVE06, Montpelier (2006) pp 117-8 view pdf
TECHNICAL DETAILS
The corpuscle was positioned on a microscope slide between a fixed metal plate and a metal plate attached to a Bruel and Kjaer type 4810 shaker, driven from a sine-wave generator via a power amplifier. The metal plates were positioned by micro-manipulators. A miniature accelerometer was used to monitor the waveform of the sinusoidal motion, to check for harmonic distortion. A trigger pulse from the sine-wave generator provided a phase reference for the sinusoidal motion; the microscope camera was triggered at a variable time interval after this trigger pulse so as to obtain images at phase steps of 36° within the sinusoidal motion, i.e., ten per cycle. Individual images taken from different cycles were assembled to provide an overall picture of the sinusoidal motion.
RESULTS
Fig. 2 shows grey-scale profiles along the same line in a series of images (covering two stimulation cycles in phase steps of 36 degrees). The layered structure of the corpuscle provides visible landmarks whose position can be tracked. Fits to these visible landmarks (e.g., the dotted sine waves in Fig. 3) provide amplitude and phase information for the tissue displacement, as a function of position (depth) within the corpuscle. Fig. 4 shows displacement amplitude as a function of position, for stimulation at 50 Hz, 100 Hz, 200 Hz and 400 Hz; the estimated error on intermediate points is 10%. These data can be compared to predictions of the theoretical model of Loewenstein and Skalak [2], shown in Fig.5. Some discrepancies are apparent but, given the approximate nature of the model and the difficulties involved in obtaining the experimental data, the agreement is surprisingly good. Further details of the modelling are on the Touch 2 page.